Mu Cang Chai in September: Weather & climate information
What's the weather like in Mu Cang Chai in September? See the historical monthly averages for temperature, rainfall and humidity.
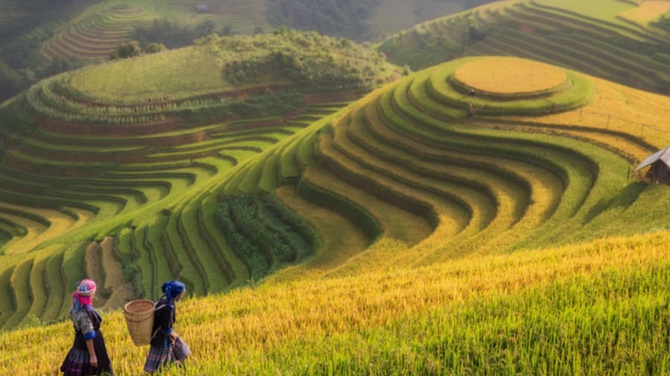 Rice fields on terraced in rainny season at Mu cang chai, Vietnam
September Averages
September in Mu Cang Chai features mild temperatures, with highs around 27.5°C and lows near 17.6°C. Expect 192mm of rain over 22 rainy days, amidst 11.4 hours of sunshine daily.| Min Temperature | 17.6°C | Precipitation | 192.0mm |
| Max Temperature | 27.5°C | Rainy Days | 22.0 days |
| Humidity | 81.6% | Sunshine Hours | 11.4 hours |
Historical weather
September weather averages for Mu Cang Chai in the last 14 years ( 2010 to 2024).
September
2019
- 2010
- 2011
- 2012
- 2013
- 2014
- 2015
- 2016
- 2017
- 2018
- 2019
- 2020
- 2021
- 2022
- 2023
- 2024
| Mon | Tue | Wed | Thu | Fri | Sat | Sun |
|---|---|---|---|---|---|---|
1 16.0°23.0° | ||||||
2 19.0°23.0° | 3 16.0°21.0° | 4 19.0°26.0° | 5 22.0°27.0° | 6 17.0°25.0° | 7 18.0°25.0° | 8 19.0°24.0° |
9 13.0°22.0° | 10 18.0°21.0° | 11 14.0°23.0° | 12 14.0°23.0° | 13 18.0°24.0° | 14 18.0°26.0° | 15 20.0°27.0° |
16 18.0°26.0° | 17 16.0°24.0° | 18 15.0°24.0° | 19 17.0°23.0° | 20 16.0°24.0° | 21 13.0°22.0° | 22 12.0°22.0° |
23 14.0°22.0° | 24 13.0°21.0° | 25 13.0°22.0° | 26 10.0°19.0° | 27 13.0°21.0° | 28 14.0°23.0° | 29 17.0°24.0° |
30 18.0°24.0° |
Temperature Graph (°C)
The average Mu Cang Chai temperature during September is around 22.2°C (71.96°F).
| Month | High | Low | Changes |
| August | 28.3°C (82.94°F) | 18.7°C (65.66°F) | -0.2°C (31.64°F) |
| September* | 27.5°C (81.5°F) | 17.6°C (63.68°F) | -0.9°C (30.38°F) |
| October | 25.3°C (77.54°F) | 15.0°C (59.0°F) | -2.5°C (27.5°F) |
Humidity Graph (%)
The average humidity in September in Mu Cang Chai is 81.6%, which is 0.5% lower than August and 0.8% higher than October.
Rainfall Graph (mm)
Average rainfall in September in Mu Cang Chai: 192.0mm
| August | September* | October |
| 306.8mm (-114.8mm) | 192.0mm | 87.5mm (+104.5mm) |
Rain Days Graph
Average rain days in September in Mu Cang Chai: 22.0 days
Daylight Graph
Average daylight in September in Mu Cang Chai: 12.3h
Frequently asked questions
How is the weather in Mu Cang Chai in September?
September offers pleasant weather in Mu Cang Chai, with temperatures ranging from 17.6°C (63.68°F) to 27.5°C (81.5°F). This makes September a top month for exploring the region's stunning landscapes.
Is Mu Cang Chai humid in September?
Yes, it is. In September, Mu Cang Chai experiences humidity levels averaging around 81.6%, with values typically not dropping below 57.0%.
Does it rain often in Mu Cang Chai in September?
Yes, it typically rains quite often in Mu Cang Chai in September, averaging about 22 rainy days and receiving around 192mm (7.56") of rainfall.
How many hours of daylight are there in September in Mu Cang Chai?
In September, Mu Cang Chai enjoys an average of 12.3 hours of daylight, making it a great time to explore its stunning landscapes.
How long is the sun out per day in Mu Cang Chai in September?
The average daily sunshine in Mu Cang Chai during September is approximately 11.4 hours.
Conversations (0)
Join the conversation
Conversations
Join the conversation
ALL COMMENTS (0)
There are no comments. Add your comment to start the conversation.
Read next


